I am a Journalist-turned-Software Engineer. I love coding and the associated grind of learning every day. A firm believer in social learning, I owe my dev career to all the tech content creators I have learned from. This is my contribution back to the community.
In its May 2017 article, the economist declared "The world’s most valuable resource is no longer oil, but data". 5 years on the headline isn’t an opinion anymore but a fact.
Today Data is the raw material of the global economy, making non-tech businesses, and in fact, governments undergo digital transformation. However, this “web” of petabytes of data is meaningless without the ability to visualize and act upon it.
Data display and visualization techniques on the web have evolved significantly over the years
From complex SVG-based visualization to multi-device design philosophies - data display techniques and specifications have undergone a sea change.
But one data display style has stood the test of time. In fact, at one point this data display style was the de facto layout for just about all the pages on the internet
Yes I am talking about the Table
Why Tables?
As a UX designer or as a front-end/web developer, I am sure you have encountered data tables in your day-to-day work.
Though a regular internet user might argue that there are not many tables on the consumer websites. In the business world, especially in an enterprise setup, a data table is easily the most used data visualization style.
But why tables? Let’s find out.
Right from our childhood and through our academic life - we have been consuming one form of table or another.
From multiplication tables in schools to tables of content or index in voluminous books in colleges to statistical data in research papers - tables have been used to structure information or data for easy consumption.
At workplaces - A data table is an efficient format for comparative data analysis on categorical objects.
Tables present information or data in rows and columns.
Know of any tool that has this exact setup. You guessed it right - it’s the spreadsheet.
In enterprises, a common tool that is used across all the departments is usually a spreadsheet.
People working at enterprises are used to working on spreadsheets for years - it’s this comfort with the grid style that makes data tables the de facto visualization tool in enterprises.
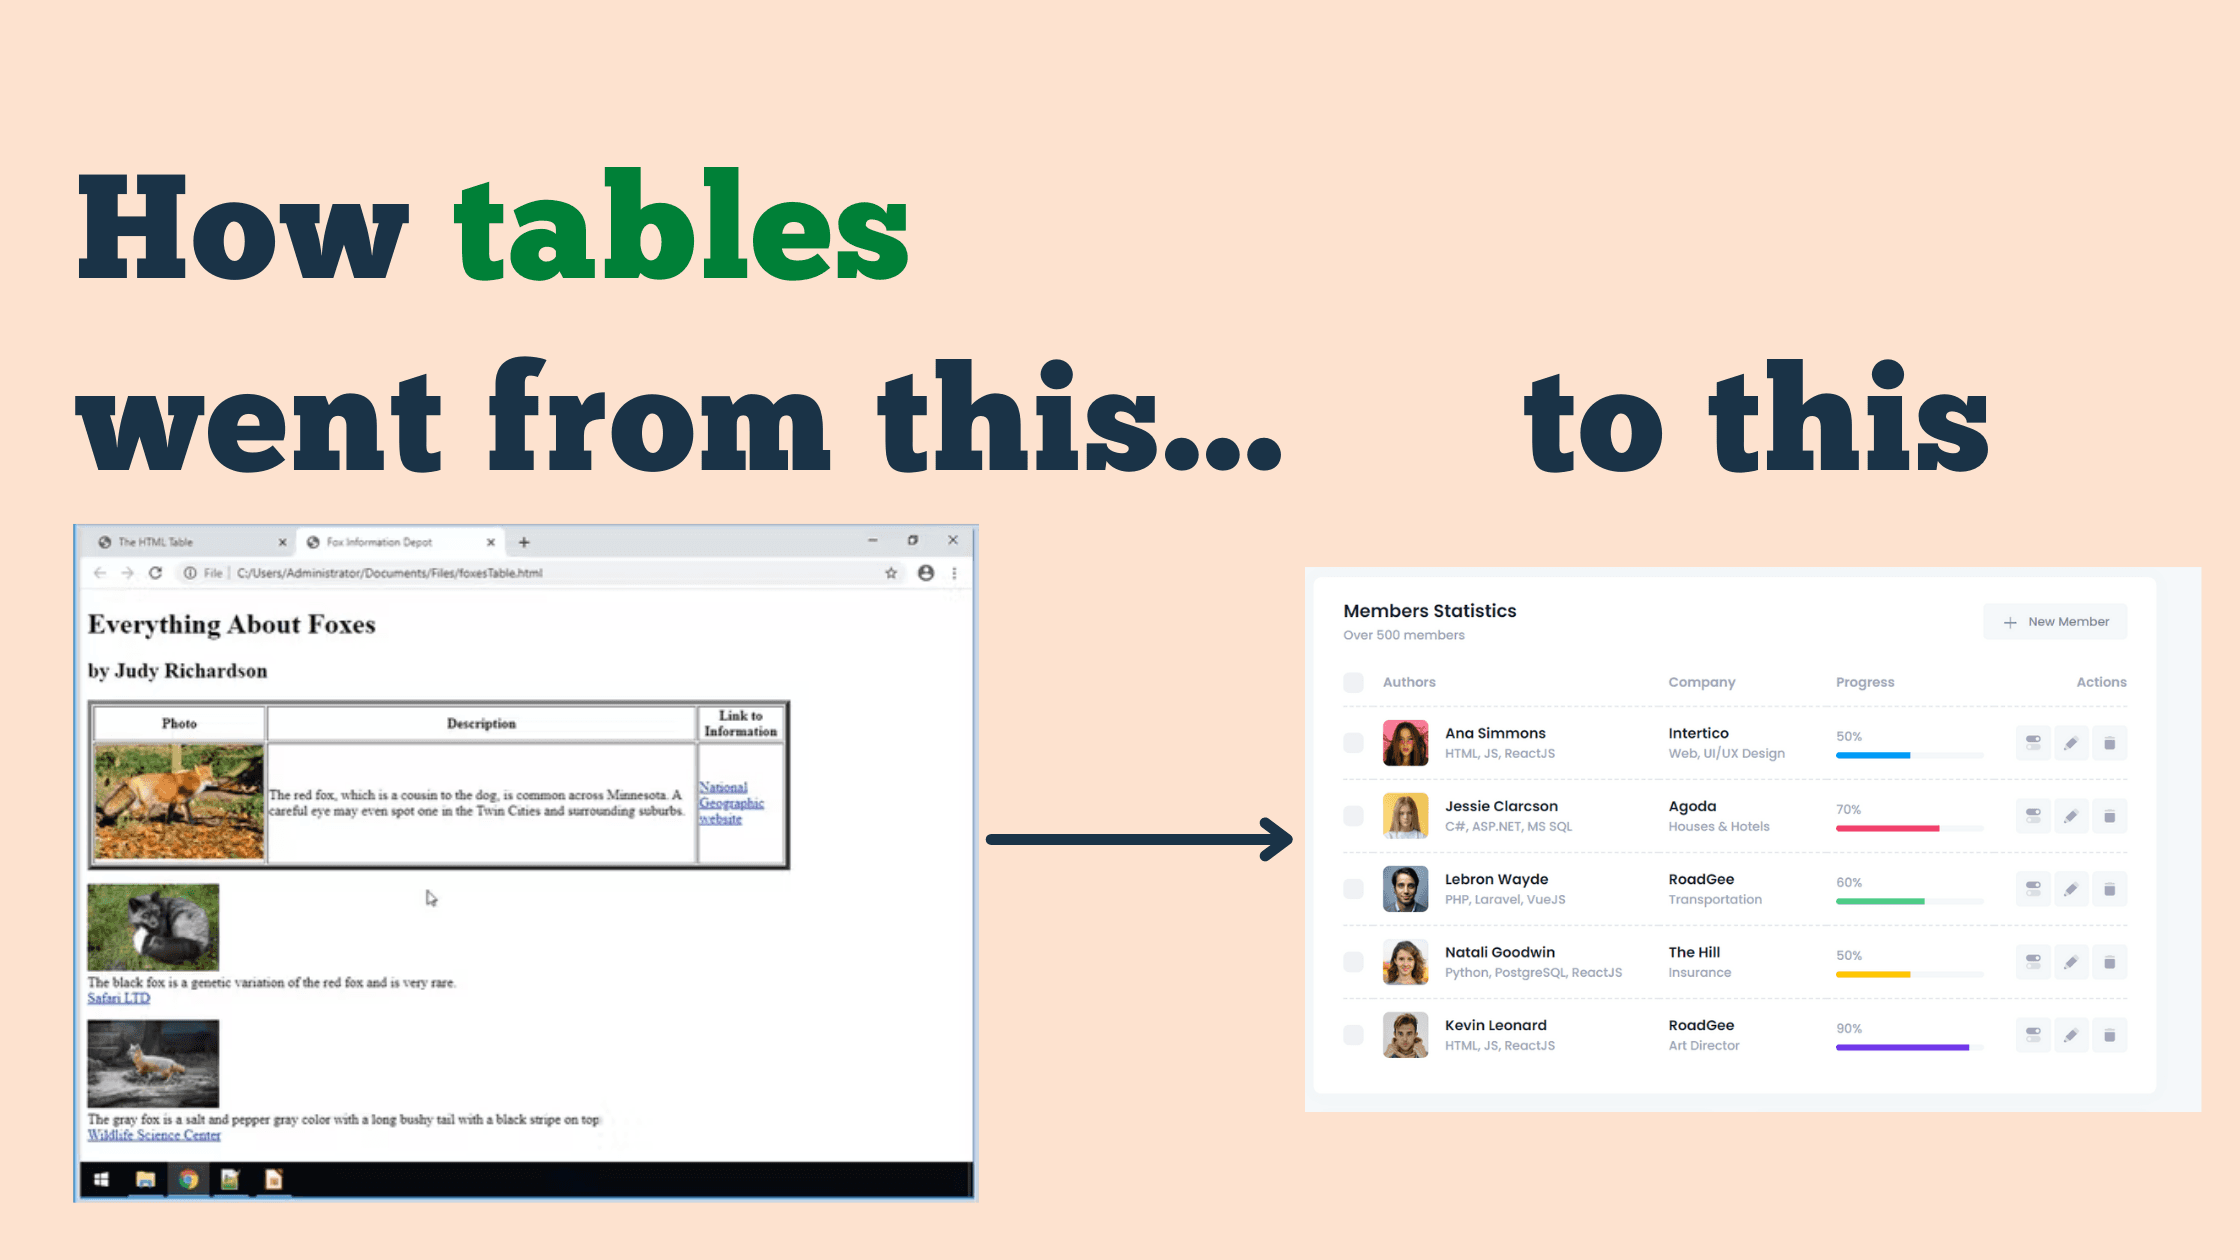
Most of us developers today, especially the ones who started our careers post 2010, are used to leveraging CSS frameworks like bootstrap to implement web layouts
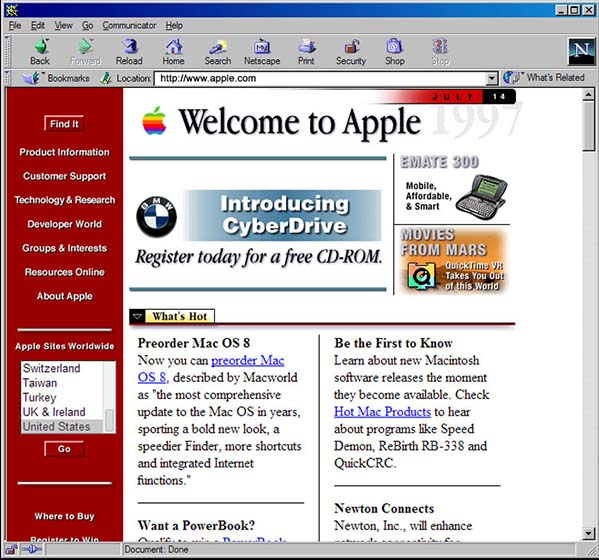
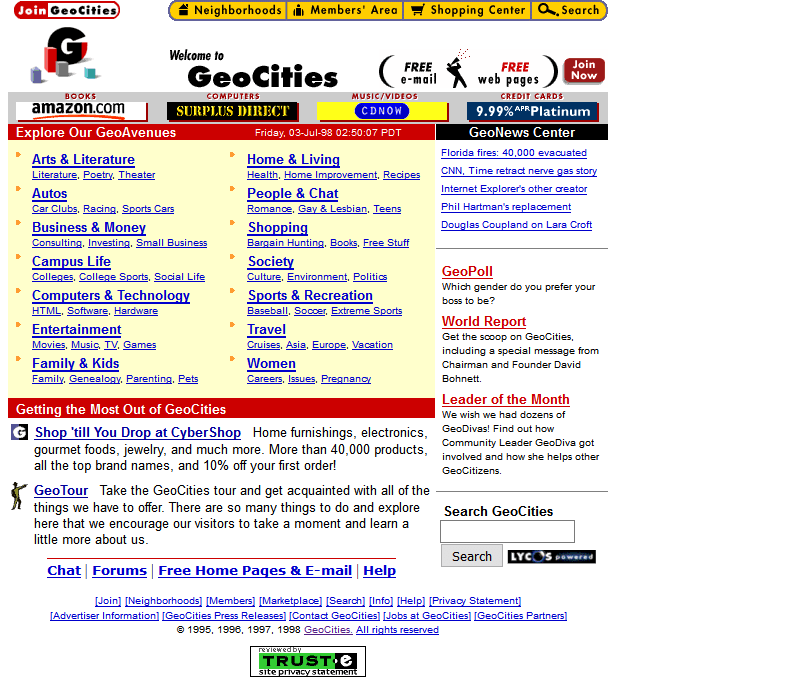
But I am sure not many of us know that in the late 90s and early 2000s - tables were used to create web layouts.
Poor Standards and Browser Wars
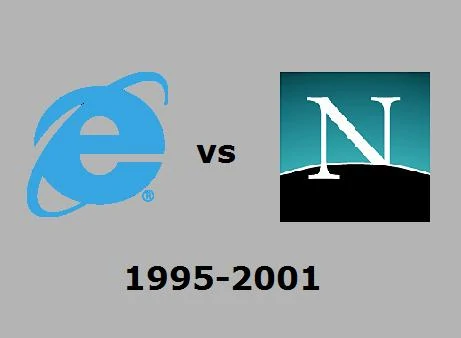
The mid-90s were dominated by 2 browsers - Netscape and Internet explorer. Both engaged in their relentless pursuit to add exclusive HTML capabilities to outdo each other.
Yes, there were web standards - but were in their infancy and weren’t dependable.
No standards meant - if a site was designed for Internet Explorer then there was a very high chance it would break in Netscape, and vice-versa.
As the competing browsers advanced ahead with their capabilities - the web standards struggled to keep up with the pace of browser development.
And it is during this period that tables’ usage in web layout gained widespread adoption.
Two or 3 column layouts, image grids, and even cells that contained nested tables - turned a webpage into one giant table.
So a table that was meant to display data was now used to create full-page layouts.
Full-page table layouts and their problems
However, these layouts came with their own set of problems. Browsers had to count columns properly before rendering the page and this came at a cost resulting in significant performance impact.
But the most significant draw drawback was accessibility. Device parsing the page would interpret the entire page as a table leading to errors.
Web Content Accessibility Guidelines in 1999 clearly advised against the usage of HTML layouts and strongly recommended using style sheets.
With the release of HTML 4 in 1999 and W3C standards catching up - the HTML rendering was fairly similar across browsers.
In the early 2000s, HTML layouts gave way to CSS best practices and with the combination of JQquery and CSS frameworks - tables were used to display data in grid-style.
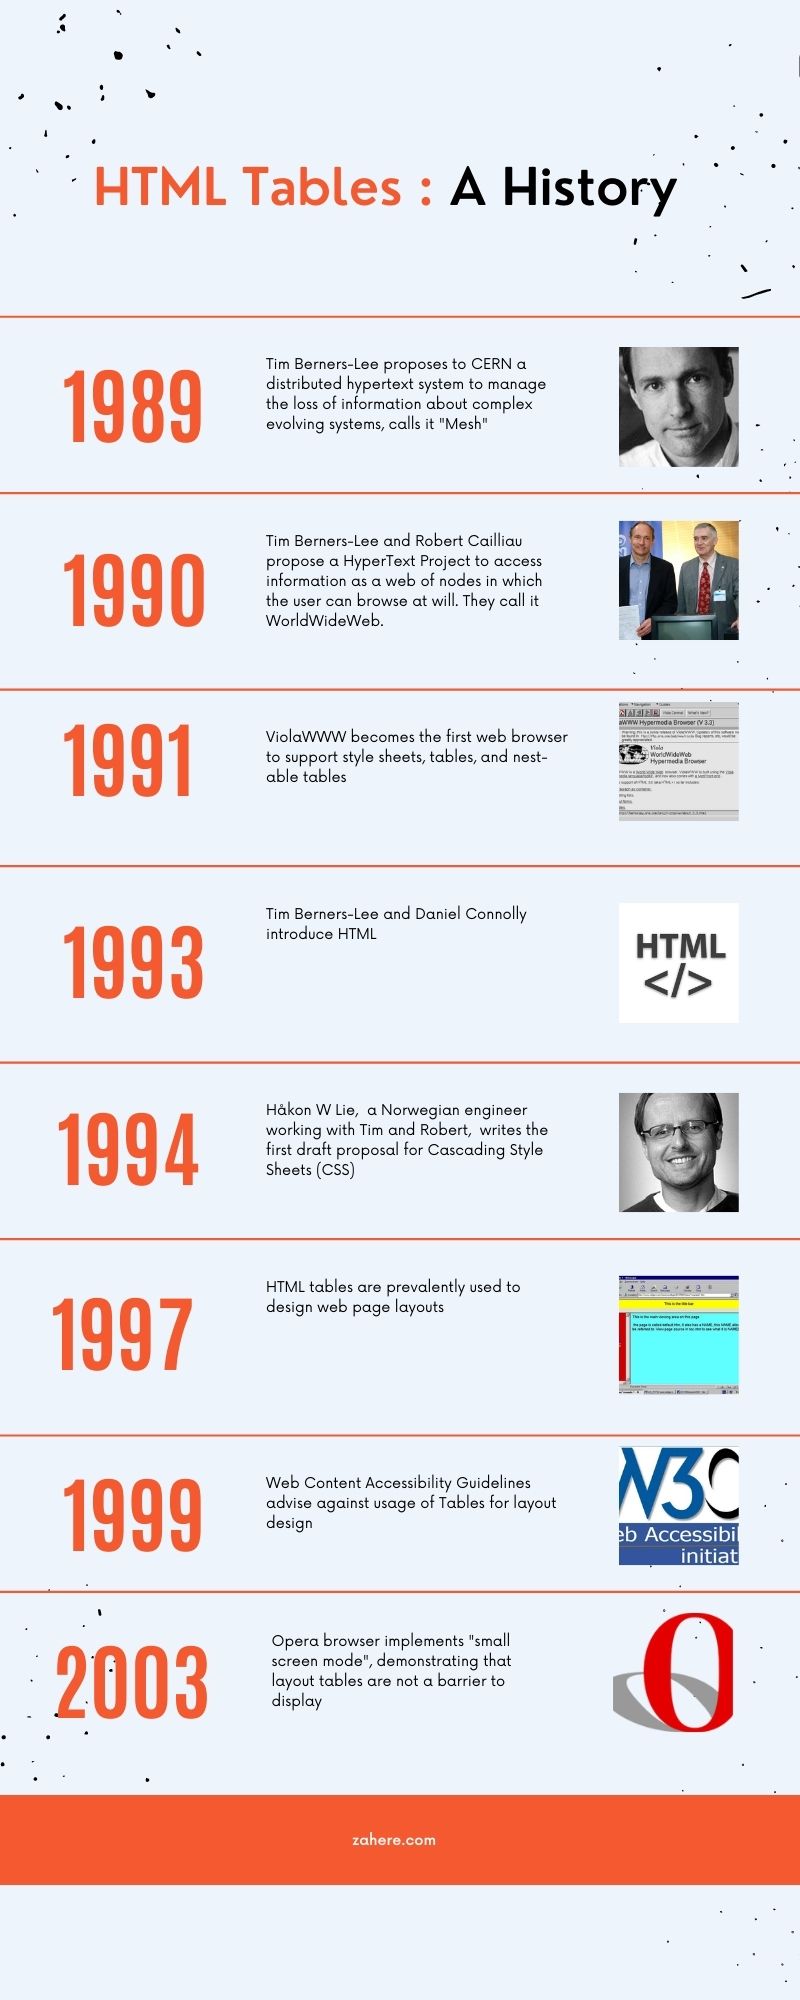
A timeline of key events that shaped the table of today
In the second part of this series, we will talk about tables from a designer's perspective.